Quarterly OLED and Mobile/IT LCD Fab Utilization Report
Report Summary
패널 업체의 팹 가동율에 따라 여러 장비와 소재 공급업체의 재무 결과를 바탕으로 기업들과 업계 애널리스트, 재무 분석가가 OLED 및 모바일/IT LCD 업체의 팹 가동율이 성과와 업계 전망에 미치는 영향을 평가할 수 있도록 본 리포트를 발간했습니다.
-
File Format
Excel 피벗테이블, PDF 요약본 -
Order Report
With a number of equipment and materials suppliers’ financial results dictated by panel suppliers’ fab utilization, we developed this service to help companies, industry analysts and financial analysts assess the impact of OLED and mobile LCD suppliers’ fab utilization on company performance and the industry outlook.
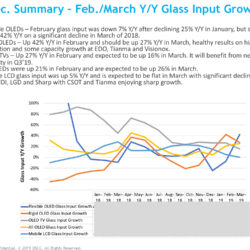
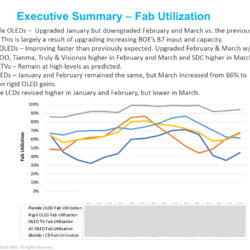
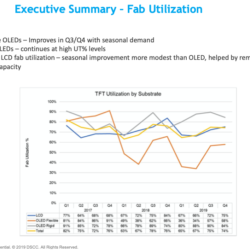
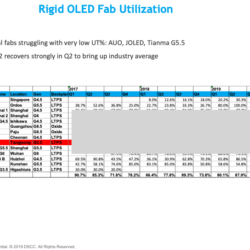
For every OLED and LTPS LCD mobile fab, we reveal their capacity and glass input by month. This information is provided by month and forecasted forward one quarter. There are two deliverables per quarter.
The capacity and utilization data is provided through a series of pivot tables covering glass capacity and input in sheets and area.
- Capacity – sheets and area
- Input – sheets and area
- Utilization – sheets and area
The utilization data can be segmented by:
- Supplier
- Country
- TFT Generation
- Backplane
- Frontplane
- Substrate type – rigid vs. flexible vs. foldable
In addition to the pivot tables, analysis is provided through PPT slides.
Areas Covered:
- Capacity, glass input and fab utilization by month for:
- Mobile OLEDs
- Mobile LCDs
- Previous/current months results + 1 quarter forward forecast
- Sortable by:
- Supplier
- Country
- TFT Generation
- Backplane
- Frontplane
- Form Factor
- Technology
- Fab Generations Covered:
- 3.5, 4.5, 5.5, 6 and 8.5
제품 카탈로그 다운로드
DSCC는 매년 100건 이상의 디스플레이 산업 관련 리포트를 발간하고 있습니다. 우리의 사명은 모든 디스플레이 기반 제품에 대한 worldwide/end-to-end 서플라이체인에 대한 종합적인 분석을 제공하는 것입니다.


